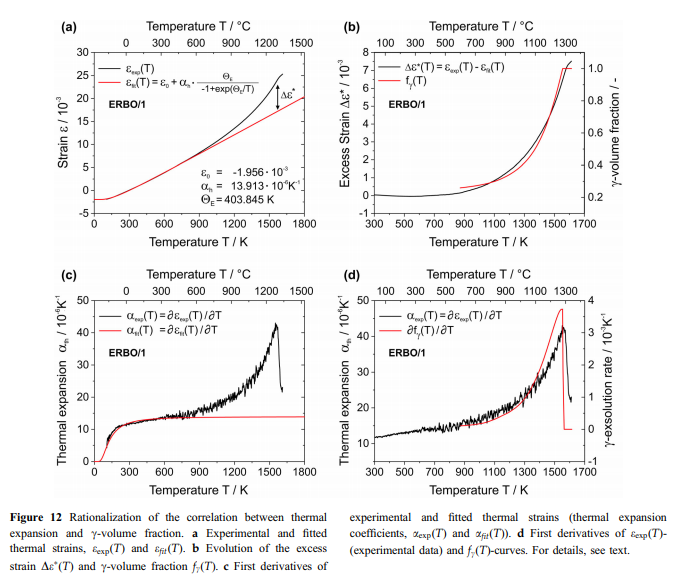
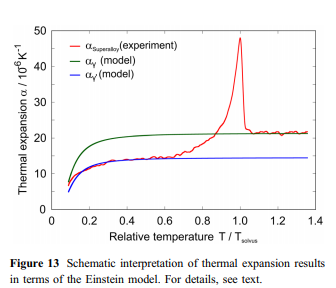
The Einstein model usually provides a good approximation of heat capacity and thermal expansion at temperatures above about hE/2. In the case of the superalloys investigated in this work, the Einstein approach describes well the observed thermal strains and thermal expansion coefficients up to about 800 K with hE varying between 396 and 412 K (Fig. 12a, c). However, at higher temperatures significant differences occur as expressed in Fig. 12a by the thermal excess strain, which represents the difference between the experimental thermal strain eexp(T) (black curve) and the extrapolated strain efit(T) (red curve, Eq. 3) determined by fitting an Einstein model to eexp(T) below 800 K. The experimental curve further undergoes a change of slope, which can be better appreciated considering its first derivative aexp(T), black curve in Fig. 12c. In Fig. 12b, De(T) (black curve) is presented together with the evolution of the c-volume fraction fc(T) (red curve) as predicted by ThermoCalc. It can be clearly seen that both curves show similar trends, which is even more evident for their first derivatives (Fig. 12d). This strongly suggests that the temperatures, where changes of slope of the ethcurves are detected, i.e., where the ath(T)-curves show a sharp peak, represent c-solvus temperatures. Simi- & lar effects have been reported for ternary Ni–Fe–Al alloys [54], CMSX-2 [55] and Co-based alloys [56, 57]. Figure 13 schematically illustrates how the experimentally observed thermal expansions can be rationalized. In a first-order approximation, one can assume that the thermal expansions of the two isolated phases each follow an Einstein model (Eq. 5). Different model parameters result in the fact that at high temperatures, the c-phase (green curve) reaches significantly higher values than the c-phase (blue & curve). The red line schematically illustrates the experimental data for a superalloy, which contains both phases (Fig. 3). The thermal expansion of the c-& phase (high initial c&volume fractions close to 70%) dominates for T 800 K. Starting at about 800 K, the gradual dissolution of the c-precipitates and the corresponding increase in the volume fraction of the c-phase (Fig. 12b) are associated with an adjustment of the chemical equilibrium compositions of the two phases. The resulting changes in unit cell dimensions and c/c-volume fraction ratios cause the sharp peak & in the experimentally measured thermal expansion close to Tsolvus (Figs. 7, 8, 12c and d). About 50% of the excess strain De* shown in Fig. 12a can be rationalized by the decreasing effect of the lattice misfit (estimate for ERBO15 and its variants: 5 9 10–3), which provides additional contributions to the thermal strain. The remaining part of De* is probably related to changes of the unit cell dimensions of both phases related to an increase in configurational entropy. Additionally, the volume fraction of the cphase, which shows a higher coefficient of thermal expansion than the c-phase, increases with increasing & temperature. This is in line with experimental data from the literature on the thermal expansion of isolated c- and c-phases of CMSX-4 [ & 58] and on a small step-like increase in heat capacity around about 870 K in CMSX-4 reported in [59].

With increasing temperature the vacancy density increases, as was reported for Al in the seminal work of Simmons and Balluffi [60]. However, this effect is usually very small and increases exponentially up to the melting temperature of the material. It is not related to the sharp peak observed in the experimental ath(T)-curves. Similar effects have been reported for example for the order/disorder transformations in CuAu [61] and Ag3Mg [62]. The dilatometric results of Fig. 8 and the CALPHAD predictions of Fig. 9 are combined in Fig. 14. The dilatometric curves exhibit a sharp maximum of thermal expansion at high temperatures, which for ERBO/1-C (1557 K) coincides with the c-solvus & temperature (1555 K) predicted by ThermoCalc (Fig. 14a). However, for all three as-cast ERBO/15 variants, the ath(T)-maxima are observed at temperatures, which are about 40 K higher than the c-solvus & temperatures predicted by ThermoCalc (Fig. 14b–d). In Table 10, the peak temperatures from Figs. 7, 8 and 14 of all four investigated alloys are shown.


In Fig. 15, we compare our ERBO/1 thermal expansion data (presented in red) with results which were published in the literature. The elastic ERBO/1 data we have used so far represent true ath data (red solid line), which were obtained as described in the experimental section of this work. In Fig. 15, we show these data together with mean ath data, which were calculated using 295 K as reference temperature according to:


