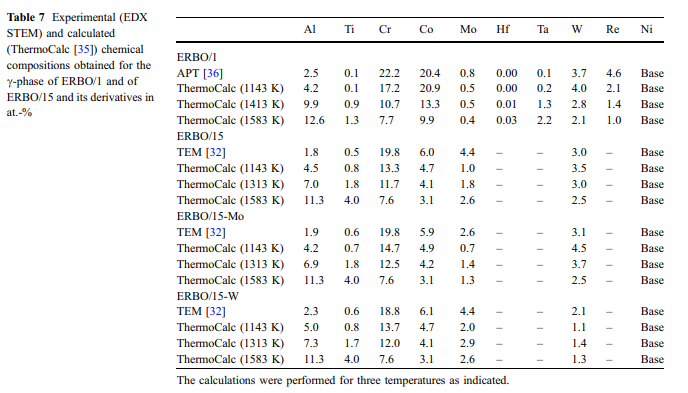
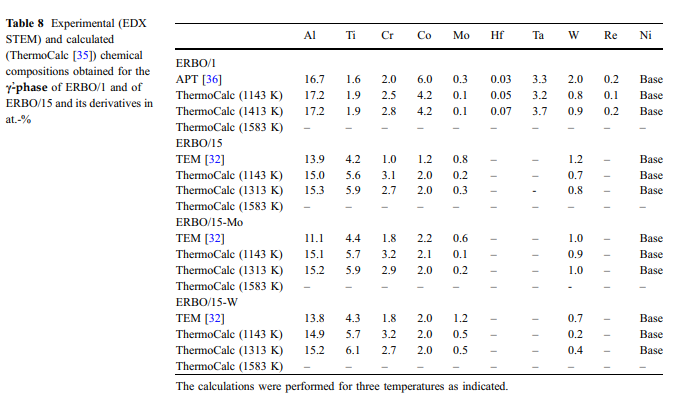
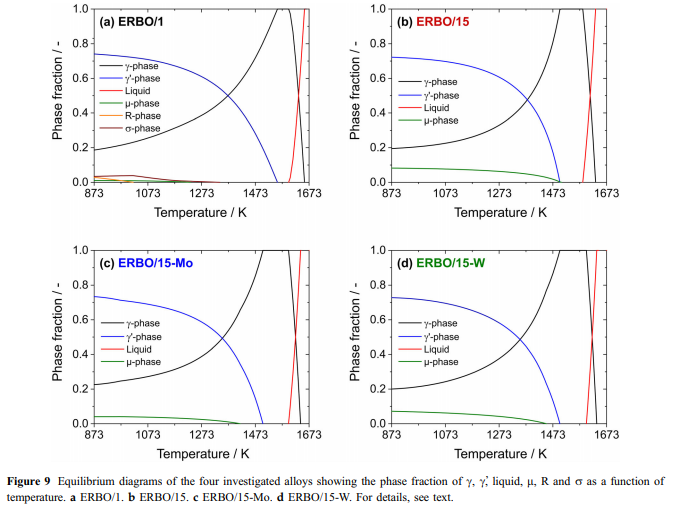
Calculated and measured phase compositions: The compositions of the c- and c-phase ( & cc and cc&) in the four investigated alloys were measured with 3D APT (ERBO 1) [36] and with TEM-EDX (ERBO 15 and derivatives) [32]. The experimental results for the two phases are presented in Tables 7 (c-phase) and 8 (c-& phase). Tables 7 and 8 also contain ThermoCalc predictions obtained for temperatures at 1143 K (temperature of second precipitation treatment step for all alloys), at 1413 K and 1583 K (ERBO/1; temperature of first precipitation treatment step and homogenization, respectively) and at 1313 K and 1583 K (ERBO/15 variants; temperature of first precipitation treatment step and homogenization, respectively). Since the c-phase exhibits a smaller volume fraction than the c-phase, changes in its chemical composition & are more pronounced. In Figs. 10 and 11, we presentchemical compositions for the c-phase from Table 7 as pie charts. Figure 10 shows experimental data, which were measured in all four heat-treated alloys prior to creep. ThermoCalc predictions obtained for the c-phases of ERBO/1 (1143, 1413 and 1583 K) and for ERBO/15 (1143, 1313 and 1583 K) are presented in Fig. 11.
The data presented in Table 7 and Figs. 10 and 11 (c-phase) and in Table 8 (c-phase, data presented & without graphics) show that increasing temperatures result in increasing amounts of Ti, Al and Ta and simultaneously decreasing amounts of Cr, Co, W and Re for ERBO/1 in the c-phase. As can be seen in the ThermoCalc results presented in Fig. 11, the amount of the base element Ni is increasing with increasing temperature in ERBO/1. In contrast, it decreases with increasing temperature in ERBO/15.The thermodynamic data for the c- and the c-phases in & Table 7 (and Figs. 10 and 11) and Table 8, respectively, further show that the ThermoCalc data for 1143 K (temperature of last precipitation treatment of experimental alloys) and experimentally determined data are not in full agreement but reasonably close to each other for both alloy systems. Only in the case of ERBO/15, the element Mo shows a significantly lower value in the calculation at 1143 K (1.0 at.%) than in the experiment(4.4at.%).
Discussion Elastic stiffnesses: As can be seen in Fig. 6a–c, all elastic stiffnesses decrease with increasing temperature. This is mainly a consequence of the anharmonicity of the lattice potential. With increasing temperature, the increasing thermal vibrations lead to larger bond distances, which result in a decrease in bonding interaction and thus in a decrease in elastic stiffnesses. The elastic behavior of ERBO/1 and ERBO/15 is almost identical, whereas the results for the leaner ERBO/15 variants for c11 and c12 fall slightly short. This does not significantly affect the elastic moduli E100[, which all are very close (Fig. 6d). As can be seen in Table 9, individual alloy elements of SX differ in size, crystal structure, Young’s modulus, electronegativity and melting point [48–51]. Figure 6d shows that the changes in alloy chemistry considered in the present work do not strongly affect elastic properties. This is in line with the conclusions drawn by Demtro¨der et al. [41], who showed that even larger variations of alloy compositions than considered in the present work do not strongly affect the elastic properties of SX. The elastic behavior of a single crystal directly reflects the anisotropy of its bonding system. The latter is mainly controlled by type, number and spatial arrangement of nearest-neighbor contacts in the crystal structure. Since the structures of Ni-base SX (including c/c’- microstructures) as well as their main chemical compositions ([ 62 at.-% Ni, [11 at.-% Al) differ only slightly, the interactions are dominated by Ni–Ni and Ni–Al contacts, leading to only small variations of the macroscopic elastic stiffnesses [42].

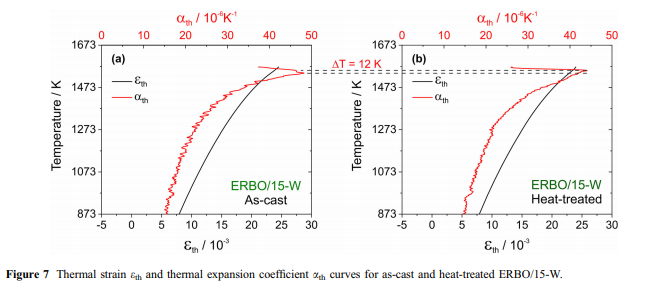
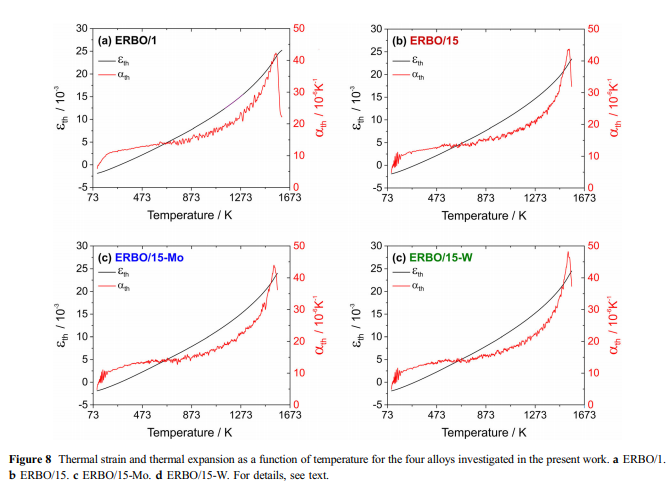
Thermal expansion and c-solvus temperatures & : Thermal expansion is associated with a material’s tendency to change its volume with increasing temperature. In a crystal, this is associated with an increasing vibrational energy of the atoms and the non-harmonic shape of the lattice potential. According to the Gru¨- neisen relation, aðTÞ is proportional to the heat capacity; thus, the thermal strain eðTÞ can be described by an integrated form of the Einstein model [52, 53]:

e0 represents the initial strain at 0 K, ah denotes the high-temperature limit of the thermal expansion coefficient, and hE is the equivalent of the Einstein temperature. The first derivative with respect to temperature yields the thermal expansion coefficient:
