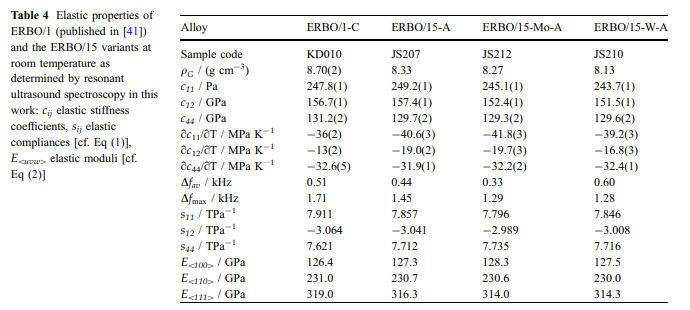
Results Elastic properties: The elastic stiffnesses of pseudosingle-crystal ERBO/15 and its variants as obtained by the RUS method at room temperature are presented in Table 4. For comparison, data for ERBO/1 from the literature [41] have been added. Additionally, the elastic compliances sij have been calculated using the relations, which hold for materials with cubic symmetry.

The directional Young’s or elastic modulus E equals the inverse of the longitudinal effect of the elastic compliances. With the direction of interest u = u1e1 ? u2e2 ? u3e3, where ei describes the basis vectors of a Cartesian reference system and the ui are direction cosine, the E moduli for selected cubic directions are obtained by:

Selected values are presented in Table 4.
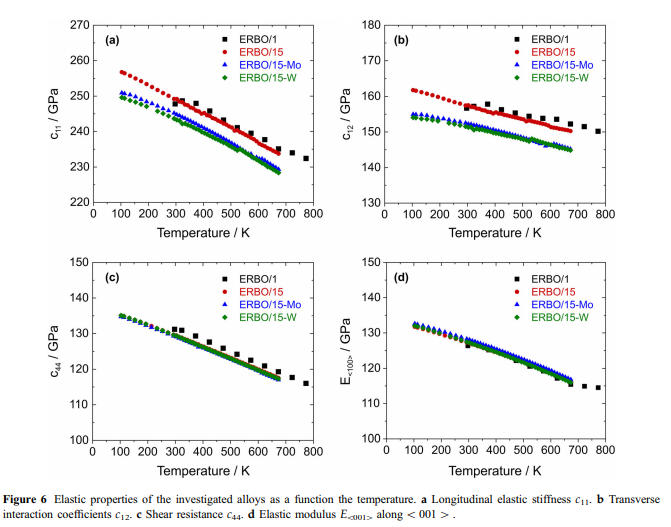
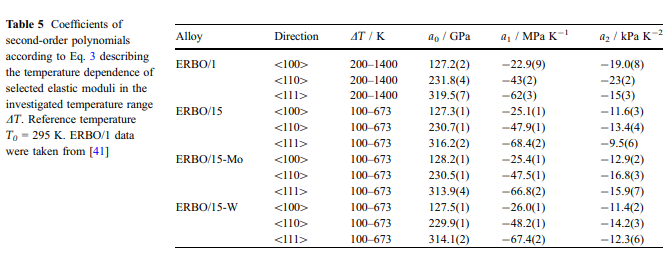
The temperature dependence of the elastic stiffnesses is shown in Fig. 6. Between 100 and 673 K, c11, c12 and c44 decrease continuously with increasing temperature by about 8.5%, 6% and 13%, respectively. Temperature coefficients of the cij as determined by linear approximations to experimental data in the temperature range 273–673 K are given in Table 4. In order to describe the temperature dependence of the E moduli in the crystallographic directions 100 [, 110 [and 111 [ , the corresponding Euvw[ data were approximated over the entire investigated temperature range by secondorder polynomials of the type:

The corresponding parameters and their standard deviations as derived from the covariance matrix of the fully converged fit are given in Table 5. As an example, values for E100[ of ERBO/1 (data from [41]) and the ERBO/15 variants (this work) are shown in Fig. 6d. Dilatometric results: Thermal expansion results for the four investigated superalloys are presented in Figs. 7 and 8. The experimental strain curves eth- = f(T) are all characterized by well reproducible changes in slope at high temperatures. This becomes particularly evident when the thermal expansion coefficients ath = f(T) are plotted as a function of temperature. These curves exhibit a sharp maximum of the thermal expansion coefficient at high temperatures. In Fig. 7, thermal strains and thermal expansion coefficients of the as-cast and fully heat-treated ERBO/15-W are shown.


ERBO/15-W are shown. It can be seen that the ath(T) peak positions of the as-cast and heat-treated materials are close, the peak temperature of the heat-treated material is only 12 K higher than that of the as-cast material. ERBO/1 was investigated in the heat-treated material state. In the case of the ERBO/15 variants, the as-cast material state was analyzed. ThermoCalc predictions and alloy compositions: ThermoCalc was used to calculate equilibrium phase fractions for all investigated alloys, based on the chemical alloy compositions given in Table 1. These are presented as a function of temperature in Fig. 9. While in ERBO/1 three thermodynamically stable TCP-phases (l-, r- and R-phase) are formed at equilibrium, only l-phase is formed in ERBO15 and its derivatives. With increasing temperature, the TCP and c-phase fractions decrease, while the frac- & tion of the c-phase increases. In Table 6, the calculated solvus (Tsolvus), solidus (Tsolidus), liquidus (Tliquidus) temperatures together with the c-phase & fractions at 873 K and 1323 K taken from the curves presented in Fig. 9 are listed. It becomes apparent that especially the calculated c-solvus temperature & for ERBO/1 is about 50 K higher than the solvus temperatures of ERBO/15 and its derivatives. While the calculated solidus temperatures are quite similar, the liquidus temperature of ERBO/1 is the highest of all four alloys. Also, the calculated c-phase fraction & fV c& at 873 K (74 vol.%) and 1323 K (56 vol.%) is the highest in the case of ERBO/1. When the Mo or W content in ERBO/15 is reduced (balanced by an increase in Ni), the calculated solidus and liquidus temperatures decrease. The reductions result in higher c-phase fractions at 873 K ( & ? 1 vol.%) but lower c-phase fractions at 1323 K ( & -3 vol.%).


