1. Materials and Methods
The exact chemical compositions (in mass%) of Hastelloy-X alloys with 0 and 0.12 yttrium are called HX and HX-a, respectively, and are shown in Table 1. These two specimens were built in the shape of a 45 × 45 × 45 mm cube by using the EOS M290 SLM machine (E.O.S., Robert-Stirling-Ring 1, 82152, Krailling, Bavaria, Germany) in a protective Ar atmosphere using pre-alloyed powders and the same processing parameters. We conducted standard heat treatment for both the HX and HX-a specimens. Solution heat treatment (ST) was performed at 1177 ◦C for 2 h, followed by air cooling to room temperature

For the creep test, we sliced the cube into a number of slabs with a thickness of 3.1 mm; from these slabs, the creep test specimens were cut out using an electro-discharge wire cutting machine. The gauge dimensions of each specimen were 19.6 × 2.8 × 3.0 mm. We conducted the creep test under 900 ◦C/80 MPa conditions. The specimens were polished using SiC emery paper up to grade 1200# followed by diamond paste up to colloidal silica (0.5 µm) using a Struers (Ballerup, Denmark) automatic polishing machine. All the specimens were then washed with ethanol in an ultrasonic bath for 10 min. We etched the specimens with 20% phosphoric acid + 80% water solution to observe the molten pool boundaries. The microstructural observation was conducted using an optical microscope (OM; Olympus Corp. Tokyo, Japan), a scanning electron microscope (SEM; Hitachi, Ltd., Tokyo, Japan), energy-dispersive spectroscopy (EDS) (S-3700N type EDS equipment manufactured by Horiba Seisakusho Co., Ltd., Kyoto, Japan), and field emission electron microscopy (FE-SEM) (JSM-7100, JEOL, Tokyo, Japan) attached to an EDS (EDAXAMETEX 9424). Image J software (64-bit Java 1.8.0_172) was used to analyze crack fraction and porosity measurements.
3. Results
3.1. Microstructure Observation
3.1.1. As-Built Specimens
Figure 1 shows the HX and HX-a specimens’ optical microstructures in the as-built condition. All were manufactured using the same processing parameters. The HX-a specimen exhibited more cracks than HX (Figure 1a) because the HX-a specimen contained additional yttrium (Y) alloying elements that the HX specimen lacked. The notable point is that all the cracks were parallel to the building direction (BD) (Figure 1b). The crack fractions for the HX and HX-a specimens are 1% and 5%, respectively.
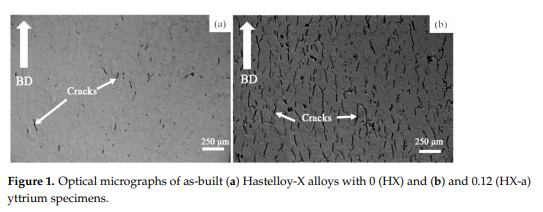
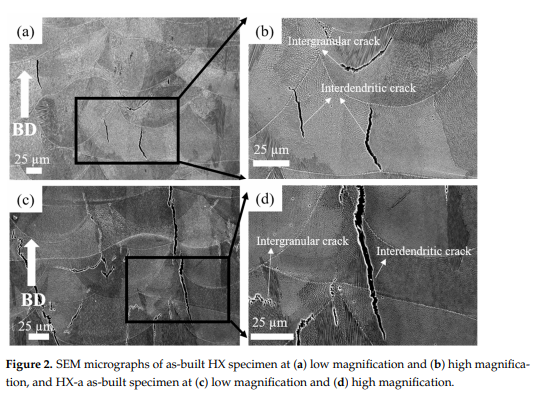
Figure 2 shows SEM micrographs of the as-built specimen. At lower magnification, all specimens showed molten pool boundaries and solidification structures, such as grain boundaries and dendrites (Figure 2a,b for HX and Figure 2c,d for HX-a). Figure 2b shows cracks at higher magnification in the HX specimen. In both specimens, the cracks were formed along the grain boundary and appeared in interdendritic regions.
We performed EDS mapping scans at the cracks of the HX and HX-a specimens. EDS analysis revealed SiC carbides and W6C formation in the HX specimen (Figure 3a). In the HX-a specimen, EDS mapping at the crack showed the formation of YC (Figure 3b).
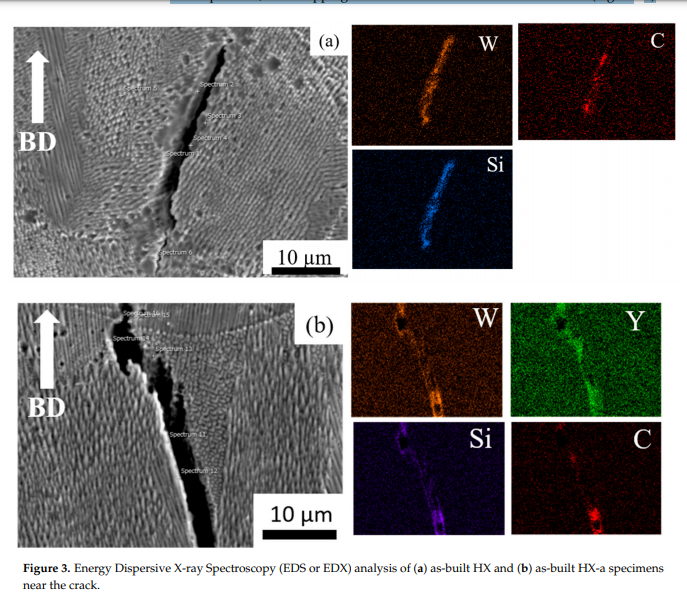
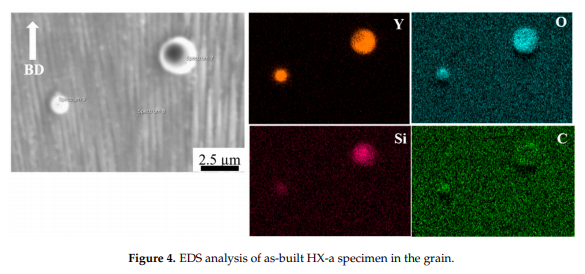
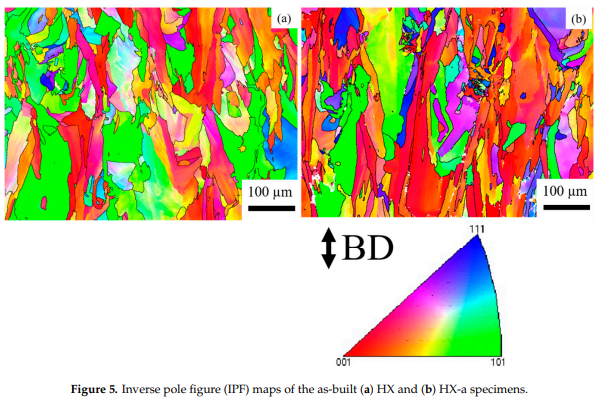
Figure 4 shows EDS mapping of the HX-a as-built specimen, which indicates the existence of small Y oxide (yttria) and Si oxide (silica) particles inside the grain. The Electron backscatter diffraction (EBSD) crystallographic orientation maps of both specimens in the as-built condition (Figure 5) revealed columnar grains oriented nearly parallel to the building direction. In the HX specimen, some grains are oriented in the direction and some are in the direction (Figure 5a). On the other hand, the grains in the HX-a specimen are somewhat finer and mostly oriented in the direction (Figure 5b).
