Surface Characterization
Scanning Electron Microscopy (SEM) and Energy Dispersive X-Ray Spectroscopy (EDS) Analysis
SEM and EDS analyses were made on a WDX600 Oxford microscope (Leica Microsystems. Wetzlar, Germany) coupled to a Stereoscan 440 Leica scanning electron microscope (Leica Microsystems). The samples were polished using 1 μm diamond paste, rinsed with water and etanol and air dried. Different surface regions were analyzed using EDS (Table 2).
X-ray Photoelectron Spectroscopy (XPS) Analysis
XPS analyses were made on a spectrometer (model XSAM HS; Kratos Analytical Ltd, Manchester, UK) under ultrahigh vacuum (about 10-8 Torr). Non-monochromatic Mg Kα (hν=1253.6 eV) radiations were used as X-ray source, with 5 mA emission current at 12 kV voltage. The samples were polished, rinsed with de-ionized water, cleaned in an ultrasonic bath with analytical grade acetone for 5 min and rinsed with de-ionized water. Previous to these experiments, the samples were immersed in artificial saliva and 0.15 mol.L-1 NaCl solution for 8 h at Ecorr. After 8 h the surface composition was analyzed to investigate the presence of cobalt (Co) and chromium (Cr) in the composition of the passive film. As binding energy reference was used the value 284.8 eV for the carbon peak corresponding to the adventitious hydrocarbon (16). The evaluation included Shirley procedure for background subtraction, mixed Gaussian/Lorentzian function and a least-square routine for fitting the peak.
Cytotoxicity Tests
The cytotoxicity assay was carried out by exposing the cell culture to the solutions after contact with alloy samples, immersed for 10 days in culture medium MEM at 37 °C. The NCTC clone 929 cell line was acquired from American Type Culture Collection (ATCC) bank. The cytotoxicity effect was evaluated by neutral red uptake (NRU) methodology, described in previous papers (17,18), according to the International Organization for Standardization (ISO) (19).
Results
Electrochemical Results
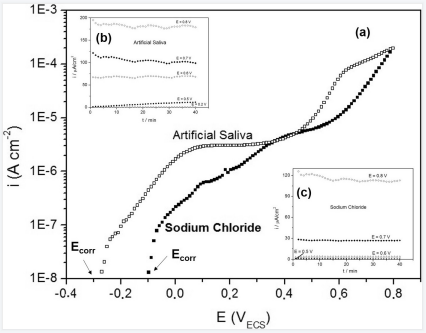
The corrosion potentials (stationary open circuit potential values) obtained for artificial saliva and 0.15 mol.L-1 NaCl solutions were -100±28 mVSCE and -277±23 mVSCE respectively (Fig. 1A). The anodic potentiodynamic polarization curves were obtained from corrosion potential and plotted in order to evaluate the effect of potential, to determine the potential range where the alloy is passivated and the value of the transpassivation potential. The chronoamperometric tests were made in order to verify the presence or not of pitting corrosion on the passive film. The obtained results from polarization curves are plotted in Figure 1A with the chronoamperometric curves at different potential values (Figs. 1B and 1C) for the alloy, in artificial saliva and NaCl medium, respectively. Chronoamperometric results are shown at different potentials and confirm those obtained by potentiodynamic polarization anodic curves, indicating the potential range where the metallic surface is passivated. The constant values of the current density observed at different potential values are an indication that the alloy does not present pitting corrosion.
 Figure 1. Potentiodynamic polarizations curves of CoCrW alloy in artificial saliva and 0.15 mol.L-1 sodium chloride at 37 oC. Panels A, B and C show the chronoamperograms response at each potential application.
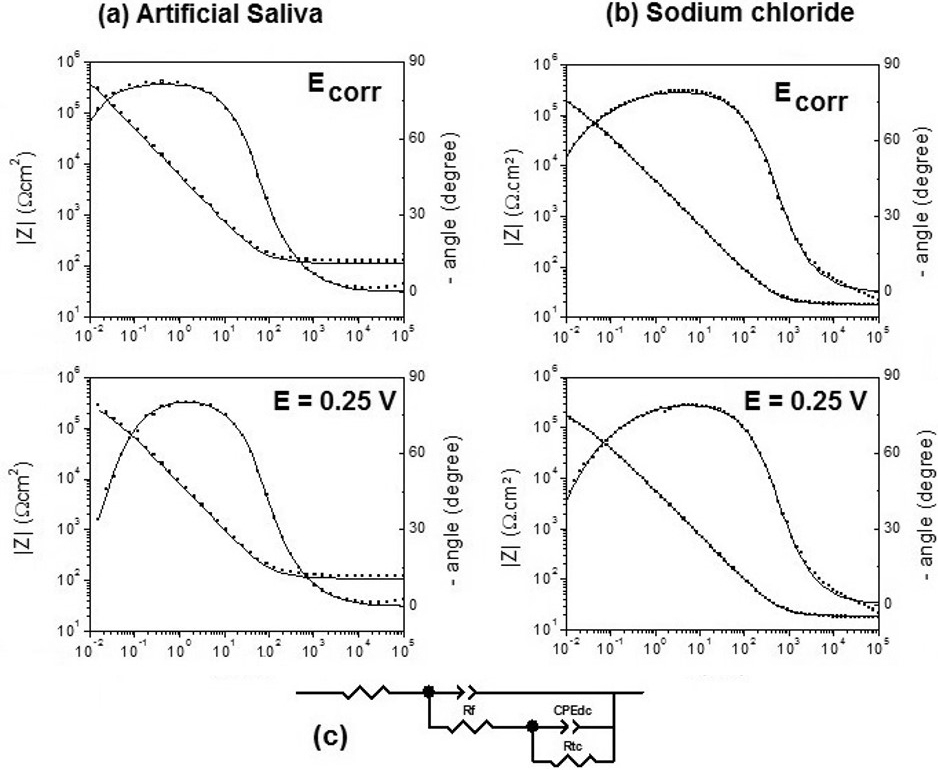
EIS was employed to investigate the passive film/ electrolyte interface and evolution with increasing potential. Figure 2 shows Bode (modulus and phase) diagrams for CoCrW in artificial saliva (Fig. 2A) and 0.15 mol.L-1 NaCl solutions (Fig. 2B) at Ecorr and 0.25 VSCE. A similar behavior may be seen for the alloy/solution interface in both media: the imaginary and real components of impedance decrease as the potential becomes more positive than the Ecorr.The proposed equivalent circuit is presented in Figure 2C, where R correspond to the electrolyte resistance, CPE and Rf correspond respectively to the constant phase element(pseudo-capacitance) and the polarization resistance for the oxidation reaction trough the protective film., CPEdc and Rct correspond, respectively, to the double layer constant phase element and the charge transfer resistance of the CoCrW alloy oxidation. The same circuit was proposed for Ecorr and at 0.25 VSCE in both media.

Figure 2. Impedance spectra of CoCrW alloy at sodium chloride (A) and artificial saliva. B: Bode plots registered at different potentials (Ecorr and 0.25 V). (•) experimental values, (___) simulation. C: Electrical equivalent circuits used to fit the experimental data at different potentials.
Surface Characterization
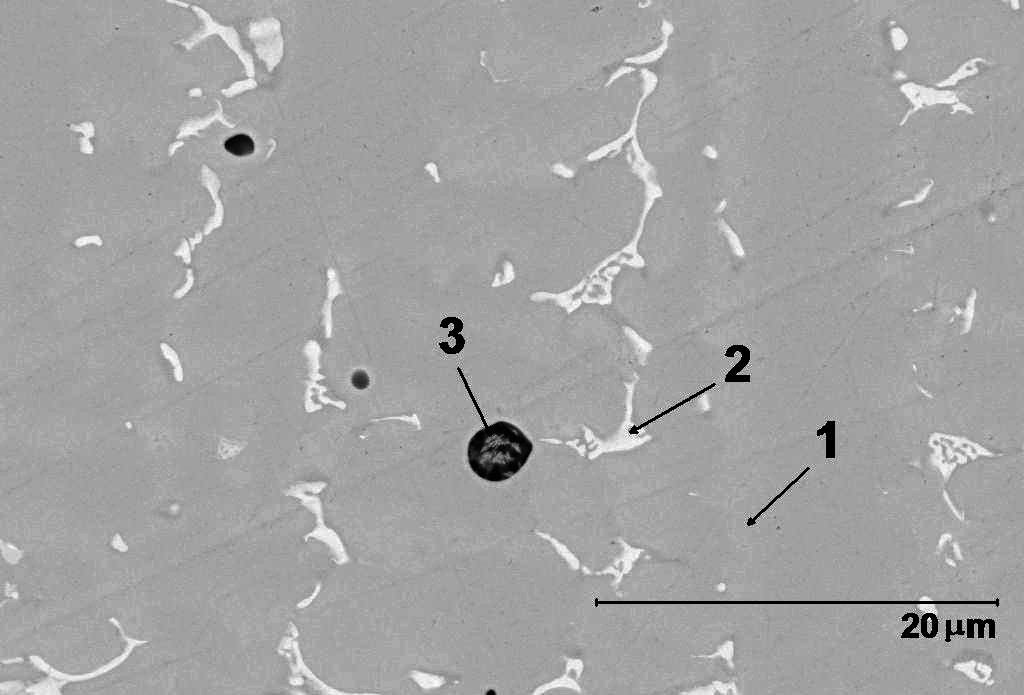
SEM and EDS analyses were made to evaluate the existence of non-metallic inclusions. Different surface regions were analyzed using EDS after polishing with
1 mm diamond paste. Figure 3 presents three different regions, 1, 2 and 3. According to EDS analysis the region 1 presents the bulk composition, region 2 corresponds to niobium carbides and region 3 is due to the presence of silicon and manganese oxides.
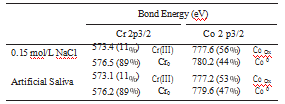
XPS was used to investigate the presence of Cr and Co in the composition of the passive film. Table 3 shows the absolute potentials of the components in the passive film. The chromium content of the surface is higher than cobalt in both media and is higher in 0.15 mol.L-1 NaCl when compared to saliva. The results showed presence of chromium (III) and cobalt oxides in the passive film.
Table 3. X-ray photoelectron spectroscopy (XPS) results for CoCrW alloy after immersed

 Figure 3. SEM and EDS images of CoCrW alloy samples polished through 1 mm diamond paste.

