Figure 7b shows the evolution of the mean thickness (minor dimension) and diameter (major dimension) of the δ phase precipitates at 700 ◦C as a function of time. The thickness and diameter demonstrate a similar trend, with an initial rapid increase followed by a gradual increase. By the end of the heat treatment, the mean thickness and diameter are 34 ± 2 nm and 154 ± 7 nm, respectively. These values are significantly smaller than the values acquired from AM IN625 after 10 h at 870 ◦C, where the mean thickness and diameter are 52 ± 5 nm and 961 ± 94 nm, respectively [21], again pointing to significantly slower precipitation kinetics at 700 ◦C. In the context of typical residual stress heat treatment, after a one-hour heat treatment at 870 ◦C, the mean thickness and diameter are 45 ± 4 nm and 424 ± 40 nm, respectively [21]; after a two-hour heat treatment at 800 ◦C, the mean thickness and diameter, depending on the build condition, range between 61 nm to 77 nm and 416 nm to 634 nm, respectively [24]. In other words, a stress relief heat treatment at 700 ◦C for as long as 10 h results in δ phase precipitates significantly smaller than those developed during typical residual stress heat treatment of AM 625.
It is worth noting that the continuous coarsening of the δ phase precipitates observed at 870 ◦C was not apparent at 700 ◦C, suggesting stability against significant coarsening at 700 ◦C, which is possibly due to the stabilization provided by the elastic energy of the strain field surrounded by the precipitates [49]. This limited growth of the δ phase precipitates during the long heat treatment at 700 ◦C is significant because the overgrown δ phase leads to reduced fracture strain [50]. Moreover, a recent review shows that direct aging at 700 ◦C for 24 h also leads to the highest reported UTS (1222 MPa) and yield strength (1012 MPa) for AM IN625, suggesting that the formation of smaller precipitates serves to improve the mechanical strength [51].
Compared with previously reported kinetics at 800 ◦C and 870 ◦C, we observed significantly slower precipitation of the δ phase precipitates at 700 ◦C in AM IN625. To rationalize our observations, we used thermodynamic calculations to understand the precipitation kinetics.
In our simulations, we assumed that all the precipitates are spherical. We also assumed that the nucleation occurs on dislocations because the pre-existing interface helps reducing the surface energy barrier of nucleation [52]. During AM processing, the compressiontension residual stress cycles induced by the localized, extreme heating and cooling conditions cause a heterogeneous distribution of local dislocation densities [53]. Consistent with previous work [33], we assumed that the dislocation density is ≈5 × 10¹¹ m−2 . This dislocation density corresponds to a nucleation site density of ≈1021 m−3 . For the precipitation simulation, we considered δ, γ 00, MC carbide, µ, and σ precipitates, with the matrix phase being γ. We assumed the interfacial energies are 20 mJ/m2 , 55 mJ/m2 , 60 mJ/m2 , 200 mJ/m2 , and 200 mJ/m2 for the γ/γ 00 , γ/δ, γ/MC, γ/µ, and γ/σ interfaces, respectively. More details about the simulation can be found elsewhere [33].
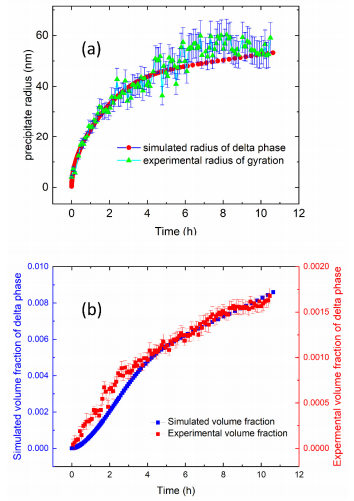
As a result of the microsegregation, the composition between the neighboring interdendritic regions is not uniform. Previous SEM measurements have shown that the secondary dendritic arm spacing of the as-fabricated AM IN625 is ≈300 nm [19]. DICTRA simulation shows that microsegregation is confined to ≈20 nm from the interdendritic centers [33]. In other words, the average composition represents a good approximation for a redistributed composition. Figure 8 shows the comparison between the experimental results and the TC-PRISMA predictions with the nominal composition. Since we assume a spherical shape for the precipitates in the simulation, we converted the observed platelet size into a radius of gyration (Rg) for direct comparison following Rg2 = R2/2 + D2/12, where R and D represents one-half of the diameter and the thickness as reported in Figure 7b, respectively. Figure 8a shows that the model-predicted radius and the effective measured Rg follow a similar kinetic trend with the simulated radius slightly smaller than the experimental value, as reflected by the Rg. When we simulate the precipitation reaction with a composition adjusted to the enriched interdendritic region, our simulations predict slightly larger precipitates with a similar kinetic time scale. Hence, a weighted average of the simulated precipitate radii associated with the interdendritic regions and dendrites is expected to be closer to the experimental values. Figure 8b shows that the simulated time-dependent volume fraction and the experimental volume fraction, acquired following a protocol detailed previously, have a similar trend except that the experimental value is smaller by a factor of ≈5. This discrepancy is similar to previously reported results acquired at 800 ◦C and 870 ◦C. Several factors could contribute to the quantitative difference, including assumed spherical geometry of the precipitates, dislocation density, and a temperature-dependence of the interfacial energy. Notwithstanding these reservations, our results still represent a good agreement between simulations and experiments given the approximate nature of the simulations.

Figure 8. (a) A comparison between the calculated (simulated) radius and experimental mean radius of gyration of the δ phase precipitates at 700 ◦C as a function of annealing time. Here, we assumed a spherical morphology for the precipitates for the simulation. Accordingly, we calculated the radius of gyration of the platelet δ phase precipitates based on experimental values reported in Figure 7b. (b) A comparison between the calculated and experimental volume fraction of the δ phase precipitates at 700 ◦C as a function of time.

