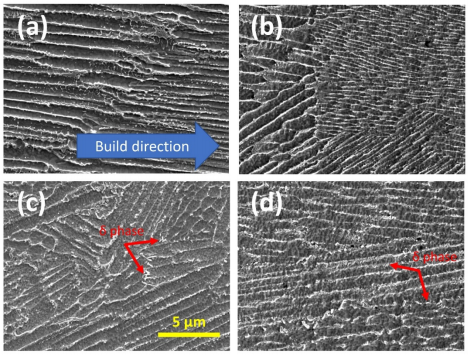
Figure 2 shows the SEM images of AM IN625 under four different conditions (Figure 2a, as-fabricated, Figure 2b, one hour at 700 ◦C, Figure 2c, 24 h at 700 ◦C, and Figure 2d, one hour at 800 ◦C), with the imaged surfaces parallel to the build direction. The dendritic microstructure is visible in all four images. An EDS analysis of the as-fabricated specimen reveals that the interdendritic regions are enriched in Nb and Mo, and the dendritic regions are enriched in Ni and Cr. The effects of different heat treatment conditions on the microstructures are subtle, with one-hour heat treatment at 700 ◦C leading to no visually observable differences under the measurement conditions. In contrast, a prolonged heat treatment at 700 ◦C promotes the formation of precipitates of a platelet morphology near the interdendritic regions. The morphology of this phase is consistent with previous observation of δ phase, with the nucleation of the δ phase being more favorable with a higher concentration of Nb and Mo [33].

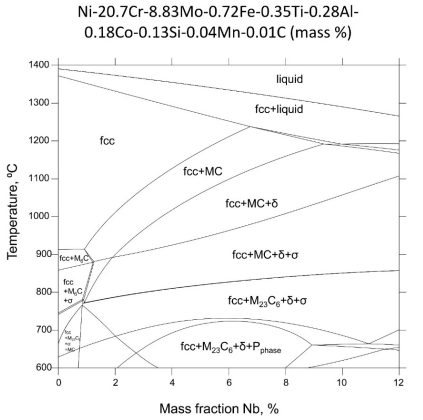
Figure 1. A steady-state Nb isopleth section of IN625 phase diagram constructed assuming a composition of Ni-20.7Cr-8.83Mo-0.72Fe-0.35Ti-0.28Al-0.18Co-0.13Si-0.04Mn-0.01C (mass%).

Figure 2. Microstructure in AM IN625 under four different conditions (a) as-fabricated, (b) after a one-hour heat treatment at 700 °C, (c) after a 24 h heat treatment at 700 °C, and (d) after a one-hour heat treatment at 800 °C. The imaged surfaces are all parallel to the build direction. Red arrows in (c,d) highlight the platelet δ phase precipitates.
A one-hour heat treatment at 800 ◦C leads to a similar change to the microstructure with the formation of δ phase precipitates, as observed in Figure 2c (24 h at 700 ◦C). We note that in both Figure 2c,d, the δ precipitates have comparable sizes. The difference in the heat treatment duration suggests that the precipitation kinetics of the δ phase precipitates is much accelerated at 800 ◦C, compared with 700 ◦C, which is consistent with the TTT diagrams [33,36] previously constructed for AM IN625. This slowdown in precipitate growth can be significant for residual-stress relief heat treatment. Previous neutron diffraction residual stress experiments demonstrated that one-hour heat treatment at 870 ◦C [6] and two-hour heat treatment at 800 ◦C [10] could effectively reduce residual stresses to less than 13% of the initial, as-fabricated levels. However, heat treatment at these temperatures creates a favorable thermodynamic condition for the precipitation of the δ phase precipitates. In both cases (one hour at 870 ◦C and two hours at 800 ◦C), the major dimension of the δ phase precipitates has a comparable nominal size of ≈500 nm [21,24]. These large precipitates preferentially grow in the interdendritic regions and decrease the ductility, fracture toughness, and the corrosion resistance of IN625 [37,38].
Figure 3 shows the in situ XRD data of AM IN625 acquired during an isothermal hold at 700 ◦C for 10.5 h. The XRD data obtained before the heat treatment at room temperature suggest that the IN625 in its as-fabricated state has an FCC matrix phase with a lattice constant of (3.595 ± 0.002) Å, with no additional detectable phases. It is worth noting that the synchrotron XRD measurements were conducted with high flux and highly penetrating X-rays using a single-photon counting detector. This measurement sensitivity means that the equilibrium phases predicted in the phase diagram other than the matrix phase did not have adequate time to form in any significant amount during the build. The singlephase as-fabricated matrix phase represents the starting point of the subsequent solid-state phase transformation.

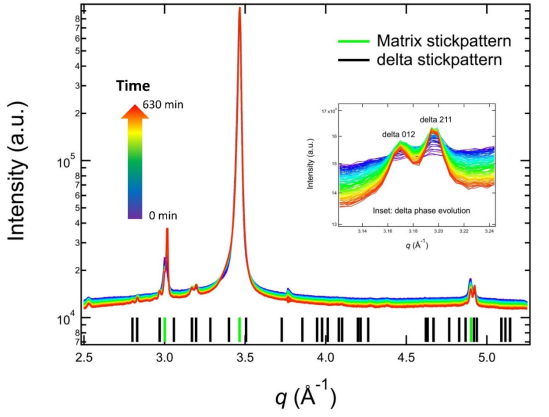
Figure 3. In situ synchrotron XRD data acquired during an isothermal heat treatment of AM IN625 at 700 ◦C. The inset shows the evolution of the δ 012 peak and δ 211 peak. The data acquisition time follows the arrowed color scale. The calculated stick patterns correspond to an FCC matrix phase and an orthorhombic δ phase.
The in situ XRD data acquired during the heat treatment allow us to monitor the thermally induced phase transformation. As shown in Figure 3, the XRD data continuously evolved at 700 ◦C, with the main feature being a monotonic increase in peak intensities of a new family of peaks. These new peaks belong to an orthorhombic structure. The stick patterns in Figure 3 are calculated based on an orthorhombic phase with lattice parameters of 5.109 Å, 4.232 Å, and 4.487Å and an FCC phase with a lattice constant of 3.626 Å, respectively. These lattice parameters are the values at 700 ◦C to directly compare the stick patterns and the in situ experimental data. The δ peaks are weak. Hence, we used an inset to highlight the time-dependent changes of two characteristic peaks of the δ phase (δ 012 and δ 211). In addition to the continuous growth of the peak intensity, we also observed a narrowing of the peak width, which is indicative of precipitate growth.
A careful analysis based on the in situ XRD could reveal the structural changes in both the FCC matrix and the precipitates. Figure 4 shows the evolution of the lattice constant of the FCC matrix. We observed a monotonic decrease in the lattice constant, indicating that the elements with large atomic radii, such as Nb and Mo, were gradually depleted from the matrix. This phenomenon is consistent with the precipitation of δ phase precipitates that consume Nb and Mo, as illustrated by Figure 3. This reduction in the matrix lattice parameter associated with the precipitation of the δ phase precipitates is also observed in service-exposed IN625 [39], except that a prolonged heat treatment (500 h) at 850 ◦C is required for the change in lattice parameter to be detectable.

